
# Introduction
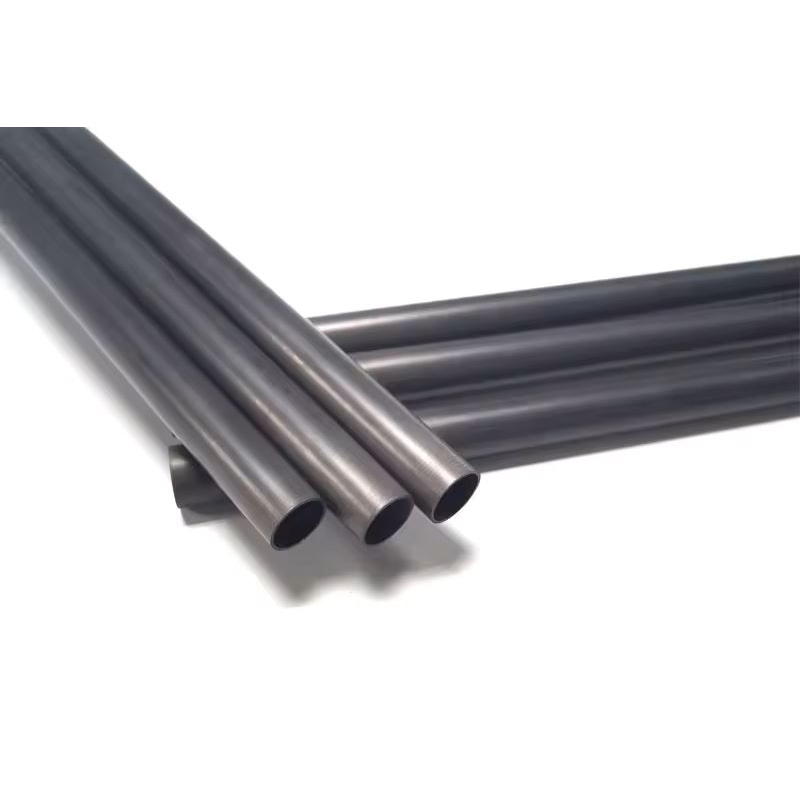
Pultruded carbon fiber tubes are critical components in aerospace, automotive, and sporting goods industries due to their high strength-to-weight ratio and stiffness. The performance of these tubes is heavily dependent on the uniformity of fiber distribution within the resin matrix. Non-uniform fiber distribution can lead to stress concentrations, reduced mechanical properties, and premature failure. Therefore, implementing a robust inspection method for uniform fiber distribution is essential for quality assurance in high-performance applications.
This article outlines a comprehensive inspection methodology that combines advanced imaging techniques, statistical analysis, and mechanical testing to evaluate fiber distribution uniformity in pultruded carbon tubes. The method is designed to be non-destructive, repeatable, and suitable for in-line production monitoring.
## Importance of Uniform Fiber Distribution
Uniform fiber distribution ensures that the load is evenly transferred across the cross-section of the tube. In pultruded carbon tubes, fibers are typically aligned longitudinally, and any clustering or void formation can create weak points. Poor distribution can result from variations in resin flow, fiber tension, or die geometry during the pultrusion process. The consequences include:
– Reduced tensile and compressive strength
– Increased variability in modulus
– Higher risk of delamination under cyclic loading
– Poor surface finish and dimensional stability
Thus, inspection methods must be sensitive enough to detect subtle deviations in fiber packing.
## Overview of Inspection Methods
Several techniques are available for assessing fiber distribution, each with its own advantages and limitations. The method proposed here integrates three complementary approaches:
1. **Optical Microscopy** – for high-resolution surface and cross-sectional analysis.
2. **X-ray Computed Tomography (CT)** – for 3D internal structure visualization.
3. **Ultrasonic Testing** – for rapid, non-destructive volumetric assessment.
These methods are combined with image analysis algorithms to quantify fiber distribution uniformity.
## Step-by-Step Inspection Procedure
### 1. Sample Preparation
Samples are cut from the pultruded tube at regular intervals along its length. For cross-sectional analysis, sections are mounted in epoxy and polished to a mirror finish. For CT scanning, small coupons (10 mm x 10 mm) are extracted without damaging the fiber architecture.
### 2. Optical Microscopy Analysis
Polished cross-sections are examined under a metallurgical microscope at 100x–500x magnification. Digital images are captured and processed using image analysis software. The software segments the image into fiber and resin regions based on grayscale thresholds. The following parameters are calculated:
– **Fiber area fraction** – percentage of cross-section occupied by fibers.
– **Fiber distribution index (FDI)** – a statistical measure of how evenly fibers are spaced.
– **Void content** – percentage of porosity.
A uniform distribution is indicated by an FDI close to 1, with minimal variation across multiple sections.
### 3. X-ray Computed Tomography (CT)
CT scanning provides a non-destructive 3D representation of the internal structure. The tube sample is placed on a rotating stage, and X-ray projections are captured at multiple angles. Reconstruction software generates a volumetric model. From this model, the following are extracted:
– **Local fiber volume fraction** – computed for each voxel.
– **Fiber orientation map** – to ensure fibers are aligned consistently.
– **Defect detection** – identification of voids, resin-rich or resin-poor zones.
CT is particularly useful for detecting internal fiber waviness or misalignment that may not be visible on the surface.
### 4. Ultrasonic Testing
Ultrasonic C-scan is performed using a high-frequency transducer (10–20 MHz) in immersion mode. The tube is scanned in a raster pattern, and the amplitude of the back-wall echo is recorded. Variations in amplitude indicate changes in acoustic impedance, which correlate with fiber density. Areas with lower amplitude suggest resin-rich zones or voids. The data is processed to create a map of fiber distribution across the entire tube surface.
### 5. Statistical Evaluation
To quantify uniformity, the coefficient of variation (CV) is calculated for the fiber area fraction across multiple cross-sections. A CV of less than 5% is considered acceptable for high-performance applications. Additionally, the spatial distribution is analyzed using nearest-neighbor distance statistics. A random distribution pattern is preferred over clustering.
## Data Interpretation and Acceptance Criteria
For high-performance pultruded carbon tubes, the following criteria are recommended:
– **Fiber volume fraction (FVF)** should be within ±2% of the specified value.
– **FDI** should be ≥0.95.
– **Void content** should be less than 1%.
– **CV** across sections should be ≤5%.
If any of these criteria are not met, the tube is rejected or subjected to further mechanical testing.
## Case Study: Application to Aerospace-Grade Tubes
A batch of aerospace-grade pultruded carbon tubes (diameter 25 mm, wall thickness 2 mm) was inspected using the proposed method. Optical microscopy revealed an average FVF of 62.3% with a CV of 3.8%. CT scans showed no significant voids or fiber waviness. Ultrasonic C-scan indicated uniform attenuation across the length. The FDI was calculated as 0.97, confirming excellent uniformity. Subsequent mechanical testing showed tensile strength of 2.1 GPa and modulus of 145 GPa, exceeding specifications.
## Limitations and Future Enhancements
While the method is robust, it has limitations. Optical microscopy is destructive and only samples a small area. CT scanning is time-consuming and expensive for large-scale production. Ultrasonic testing may miss micro-scale variations. Future enhancements include the use of machine learning algorithms to automate defect recognition and real-time process monitoring using inline sensors.
## Conclusion
Uniform fiber distribution is a key quality attribute for high-performance pultruded carbon tubes. The inspection method described combines optical microscopy, X-ray CT, and ultrasonic testing to provide a comprehensive assessment. By implementing this method, manufacturers can ensure product reliability and meet stringent industry standards. Regular inspection not only improves quality but also reduces waste and enhances process control.
Adopting this inspection protocol is a step toward achieving zero-defect manufacturing in advanced composite production.